FLAGSHIP RESEARCH · SYSTEMATIC EQUITIES
Mean-Reversion Strategy & Shared-Capital Backtesting
An early systematic equity project using Z-score deviations, disciplined exit logic, a selected-stock screener and realistic competition for a common portfolio capital pool.
The research question
Can short-term, statistically unusual weakness create repeatable mean-reversion opportunities once capital limits, trading expenses and price execution assumptions are applied? A Z-score is a way to describe deviation from a rolling historical mean, not a guarantee of reversal.
Methodology
- Signal construction: calculate price deviation relative to a recent reference mean and dispersion.
- Eligibility and screening: use the public index screener and security-selection rules to develop a consistent universe.
- Entry/exit controls: specify stops and profit exits in advance rather than rationalizing trade decisions after the fact.
- Shared-capital accounting: concurrent trades draw from one portfolio, so performance cannot assume every signal receives unlimited capital.
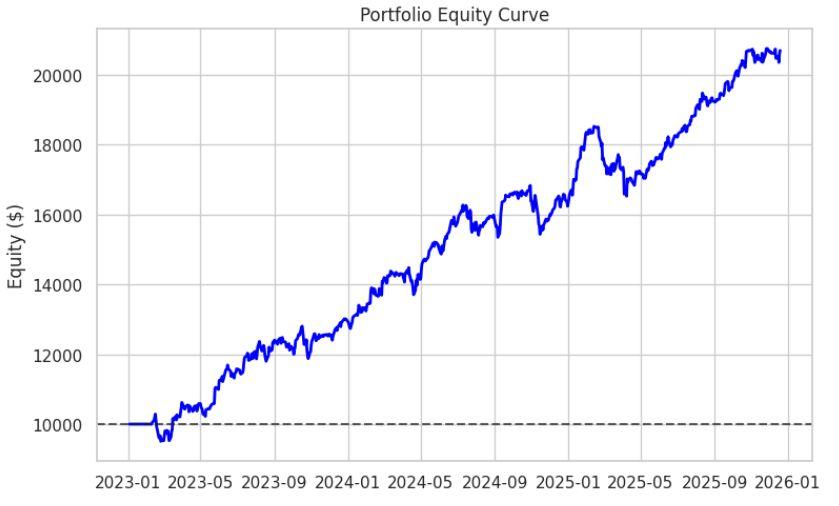
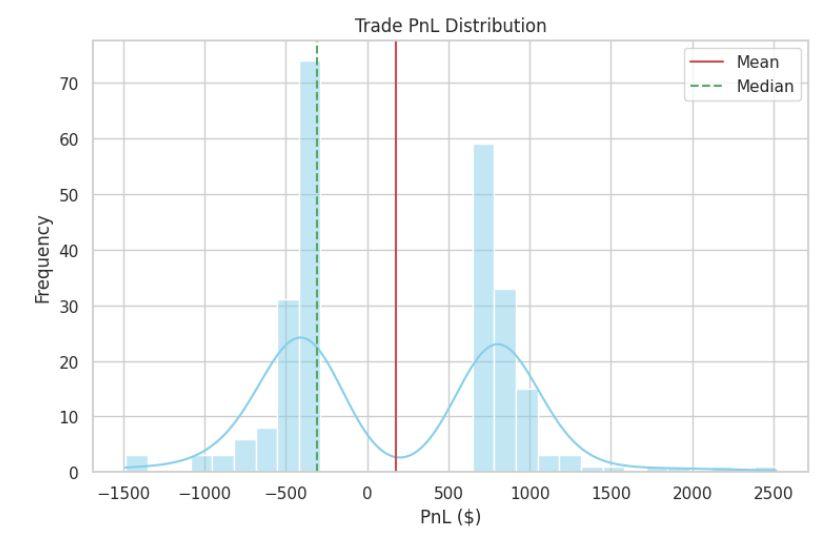
- Risk diagnostics: compare equity curve, trade outcomes, drawdowns, Sharpe/Calmar and realized exposure, with clear definitions.
The public Python repository contains the strategy and index screener. My original LinkedIn write-up discusses the shared-capital test, the reasons for the early sample horizon and a plan to validate signals in real-time paper trading.
Original research media
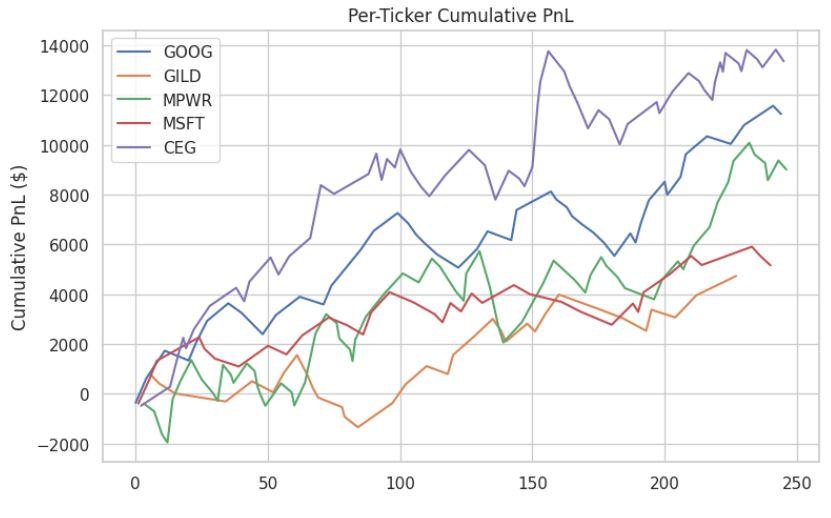
The figures below are original historical backtest outputs selected from my Z-Score Mean Reversion project archive. They show portfolio equity, the distribution of simulated trade outcomes, and how results differed across five tickers. They are research simulations rather than verified live trading results; the strategy requires further independent validation. The original LinkedIn research post provides additional project context.
Why portfolio-level evidence matters
A collection of successful simulated entries can still yield disappointing portfolio performance if the strategy is crowded on a few dates, runs out of capital, trades correlated securities or relies on unattainable fills. Cash utilization, overlapping positions and risk-adjusted returns are therefore integral to the hypothesis, not optional extras.
Limits and next steps
- The early sample included stocks with different listing histories; one constituent began trading in 2023, which limits common-history comparisons.
- Historical success requires sensitivity testing across market regimes, price-adjustment methods, and universes chosen without forward information.
- Prospective paper trading would measure whether live signals match research signals and whether intended fills are realistically obtainable.
- A comprehensive audit should quantify transaction costs, gaps, stop behavior, benchmark comparability, drawdowns, and potential selection bias.
What I learned
Mean-reversion research taught me that sound hypotheses are not enough. A backtest becomes informative only when the portfolio accounting, order timing, security universe and diagnostics describe what could actually have been done. My focus shifted from maximizing headline return to understanding the strength and limitations of the evidence.
View public research
This page summarizes an exploratory historical simulation; no audited live results or investment recommendation are asserted.
